
Crypto Transaction Graph Analysis: A Recovery Guide
Crypto transaction graph analysis is defined as the process of mapping blockchain transactions as interconnected graphs to trace fund flows, identify related wallets, and detect illicit activity patterns. The technique treats each transaction or address as a node and each fund transfer as an edge, converting raw public ledger data into a structured network that investigators can query and visualize. Because blockchains are pseudonymous rather than anonymous, this graph structure exposes relationships that scammers and fraudsters rely on staying hidden. For individuals and businesses trying to recover stolen digital assets, understanding how graph analysis works is the first step toward building a credible recovery case.
What is crypto transaction graph analysis and why does it matter?
Blockchain transaction graph analysis, the formal industry term for this discipline, operates on a simple but powerful premise: every on-chain transaction leaves a permanent, auditable record. That record connects senders, receivers, and amounts in a way that graph mathematics can interrogate at scale. Two primary graph models power this work, and each answers a different forensic question.
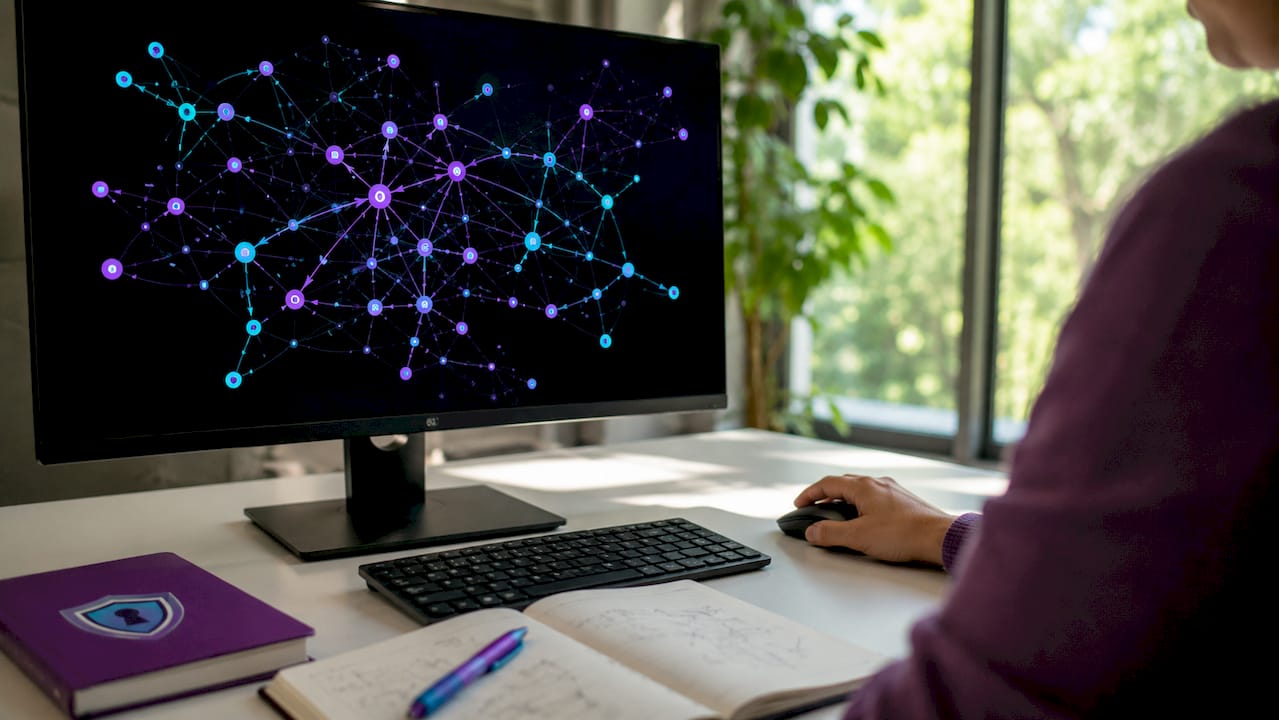
The UTXO graph treats transactions as nodes and unspent transaction outputs as directed edges connecting one transaction’s output to the next transaction’s input. This produces a directed acyclic graph, or DAG, which is ideal for tracing the precise path of specific coins from origin to destination. The address graph, by contrast, treats wallet addresses as nodes and payments as edges. Address graphs allow cycles and many-to-many relationships, making them better suited for identifying behavioral patterns and clustering related wallets into single entities.
| Graph Type | Node Represents | Edge Represents | Best For |
|---|---|---|---|
| UTXO graph | Transaction | Output-to-input link | Tracing specific coin paths |
| Address graph | Wallet address | Payment between addresses | Clustering and behavioral analysis |
Choosing the right model depends on the forensic question. A UTXO graph answers “where did these exact coins go?” An address graph answers “which wallets likely belong to the same actor?” Investigators frequently use both in parallel to cross-validate findings.
Clustering is the method that collapses thousands of individual addresses into meaningful entities. Clustering heuristics compress thousands of wallets into single entities by identifying common deposit addresses and gas-funding signatures. Treating every wallet as an independent actor inflates the apparent number of parties involved and obscures the true scope of a fraud scheme.
How do heuristics and clustering identify related wallets?
Blockchain forensics is inherently probabilistic; investigators distinguish probable from proven ownership and apply heuristics accordingly. Heuristic analysis yields hypotheses, not absolute proof. That distinction matters enormously when presenting findings to law enforcement or in legal proceedings.
The most widely used heuristic is common-input ownership. When multiple addresses fund a single transaction, the protocol requires that all inputs be signed by their respective private keys. This signing behavior strongly implies a single controlling entity. Additional heuristics extend this logic:
- Gas-funding signatures: On Ethereum and similar networks, a single address repeatedly funding new wallets with gas fees signals centralized control.
- Timing correlation: Transactions executed within seconds of each other across multiple wallets suggest automated, coordinated activity.
- Contract interaction signatures: Repeated calls to the same smart contract from different addresses indicate a shared operational layer.
- Common deposit addresses: Multiple wallets sending funds to the same exchange deposit address collapse into a single user identity.
On-chain forensics expands from the UTXO common-input heuristic into multi-heuristic approaches, especially in account-based blockchains like Ethereum. Each additional heuristic adds confidence to the cluster assignment.
Professional investigators use quantitative scoring to manage that confidence. A 0–12 point heuristic scale is employed in practice; scores below 5 are typically discarded, while scores of 8 or above are treated as high-confidence clusters. This scoring discipline prevents analysts from drawing conclusions from weak signals and reduces actor-count errors in complex investigations.
Pro Tip: Never treat a cluster assignment as confirmed ownership. Present it as a high-confidence hypothesis and document every heuristic that contributed to the score. This protects the integrity of the analysis if it is later challenged in court.
Mixing services and chain-hopping are the two primary techniques used to defeat clustering. Mixers fragment transaction trails by pooling funds from multiple sources and redistributing them. Chain-hopping moves assets across different blockchains to break the graph continuity. Neither technique is a complete defense. Mixers increase tracing complexity but rarely break the graph entirely; modern graph neural networks and temporal analysis can detect characteristic mixing patterns through behavioral fingerprints.
What behavioral patterns emerge from transaction graph analysis?
Transaction graphs reveal structural fingerprints that distinguish deliberate obfuscation from ordinary financial activity. Bitcoin transaction graph analysis reveals repeated structural fingerprints showing coordination, not random transaction noise. These patterns are useful for identifying criminal infrastructure and the operational relationships between wallets.
Peeling chains are one of the clearest laundering signals. A peeling chain is a long sequence of transactions where each step sends a small amount to a new address and passes the remainder forward. The pattern fragments funds gradually, making the trail harder to follow manually. Graph analysis identifies peeling chains automatically by detecting linear chains with consistent output-to-remainder ratios.
| Pattern | Description | Forensic Significance |
|---|---|---|
| Peeling chain | Sequential small outputs peeling from a main balance | Indicates deliberate fund fragmentation |
| Mixer transaction | Funds pooled and redistributed across many addresses | Signals obfuscation attempt |
| Exchange hub | High-volume address receiving from many unrelated wallets | Identifies off-ramp or liquidity point |
| Fan-out structure | Single source distributing to dozens of addresses simultaneously | Suggests automated disbursement or payroll fraud |
| Staging transfer | Repeated intermediate hops before final destination | Indicates layering in a laundering scheme |
Graph algorithms add analytical depth beyond visual inspection. PageRank identifies the most influential addresses in a network, which often correspond to exchange wallets, mixer entry points, or fraud operator accounts. Community detection algorithms group densely connected address clusters, revealing operational cells within larger schemes. Temporal analysis reconstructs the timeline of fund movements, which is critical for establishing when assets left a victim’s control and where they traveled next.
Pro Tip: Temporal analysis is most valuable when it aligns on-chain timestamps with off-chain events like exchange withdrawals or scam communications. That alignment turns a graph hypothesis into a corroborated forensic timeline.
Behavioral fingerprints such as repeated staging transfers or gas-funding patterns serve as durable signals that help link apparently unrelated wallets in complex money laundering schemes. These fingerprints persist even when fraudsters rotate addresses, because the underlying operational behavior does not change.
What are the practical steps for conducting blockchain graph analysis?
A structured workflow separates reliable forensic analysis from speculative guesswork. The steps below reflect the operational sequence used in professional investigations, from raw data to documented findings.
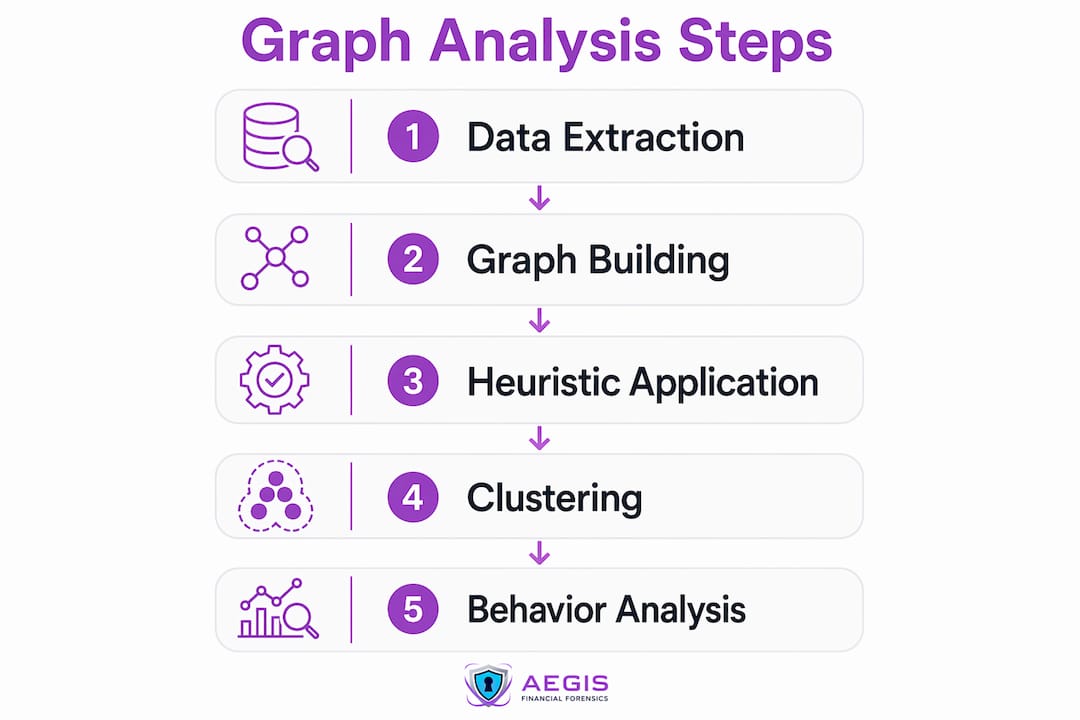
- Extract blockchain data. Pull transaction records from the relevant chain using a node, block explorer API, or a forensic data provider. Capture inputs, outputs, timestamps, and fee data for every transaction in scope.
- Build the graph. Construct either a UTXO graph, an address graph, or both, depending on the forensic objective. Load the data into a graph database that supports native temporal versioning.
- Apply heuristics. Run common-input ownership, gas-funding, and timing correlation heuristics across the graph. Score each cluster using a quantitative model and discard low-confidence assignments.
- Visualize and query. Use graph visualization tools to render the network and identify structural patterns like peeling chains, fan-out structures, and exchange hubs. Apply PageRank and community detection to prioritize high-value nodes.
- Conduct temporal analysis. Query the graph at specific historical timestamps to reconstruct fund movement timelines. Graph databases without native temporal versioning are insufficient for forensic queries; specialized tools save many hours by enabling direct historical graph state queries without manual snapshotting.
- Validate and document. Cross-check every cluster assignment against multiple heuristics. Document the scoring rationale, the data sources, and the analytical decisions made at each step. Proper chain of custody documentation preserves the evidentiary value of findings.
- Integrate off-chain intelligence. Match on-chain addresses to known exchange accounts, KYC records, or IP data where available. Off-chain intelligence converts a graph hypothesis into an attribution with legal weight.
Python libraries, graph databases, and specialized visualization and forensic software form the standard toolkit for this workflow. Temporal versioning is critical for efficient reconstructive analysis. Automation handles volume, but manual expert review remains necessary for interpreting ambiguous patterns, especially in cases involving mixers or cross-chain activity. Investigators handling complex chain-hopping cases should consult the chain-hop investigation workflow to address multi-chain continuity gaps.
Key Takeaways
Crypto transaction graph analysis converts raw blockchain data into structured evidence by mapping fund flows, clustering related wallets, and identifying behavioral patterns that reveal probable ownership and illicit activity.
| Point | Details |
|---|---|
| Two core graph models | UTXO graphs trace specific coin paths; address graphs cluster wallets by behavioral patterns. |
| Heuristic scoring discipline | Scores of 8 or above on a 0–12 scale indicate high-confidence wallet clusters worth pursuing. |
| Mixers do not stop tracing | Behavioral fingerprints and graph neural networks can still detect mixing activity patterns. |
| Temporal versioning is critical | Graph databases with native temporal queries reconstruct historical fund states without manual snapshotting. |
| Off-chain intelligence completes attribution | Combining graph analysis with KYC records and exchange data converts hypotheses into legal evidence. |
The probabilistic reality most analysts underestimate
Graph analysis is the most powerful tool available for tracing stolen crypto. I have also seen it misused more often than almost any other forensic method, and the misuse almost always follows the same pattern: an analyst treats a high-confidence cluster as confirmed ownership and builds an entire recovery case on that assumption.
The graph shows you what is probable. It does not show you what is proven. A score of 10 out of 12 on a clustering heuristic is compelling. It is not a conviction. The moment an investigator stops distinguishing between those two things, the analysis becomes a liability rather than an asset.
The arms race between obfuscation techniques and detection methods is real and ongoing. Mixers are getting more sophisticated. Cross-chain bridges are being used specifically to break graph continuity. But the behavioral layer is harder to hide than the transaction layer. Fraudsters change addresses constantly. They rarely change how they operate. The staging patterns, the gas-funding signatures, the fan-out timing: these persist across address rotations because they reflect operational habits, not just technical choices.
The most underused capability in this field is combining on-chain graph analysis with off-chain intelligence. A graph can tell you that wallet cluster A almost certainly belongs to the same actor as wallet cluster B. An exchange KYC record can tell you who that actor is. Neither source is sufficient alone. Together, they build a case that holds up.
My honest advice to anyone trying to recover stolen assets: do not attempt complex graph analysis without professional support. The methodology is sound. The execution requires experience, the right tooling, and the discipline to document every analytical decision. Errors made early in the workflow compound through every subsequent step.
— Escareno
How Aegisfinancialforensics applies graph analysis to fund recovery
Aegisfinancialforensics applies transaction graph analysis directly to crypto fund recovery investigations, tracing stolen assets across wallets, mixers, and multiple blockchains for both individuals and businesses. The team’s five-step recovery process combines AI-driven on-chain analysis with off-chain intelligence to build attribution cases that support legal action and asset seizure.
Aegisfinancialforensics has assisted with over $34 billion in illicit funds seized or recovered, working with more than 1,500 clients including major regulators and financial institutions. Cases involving chain-hopping, mixing services, and complex fan-out structures are handled within the same forensic framework, with documented evidentiary exports suitable for law enforcement cooperation. Clients who need professional graph analysis, wallet clustering, or a full forensic investigation can contact Aegisfinancialforensics directly through aegisfinancialforensics.com to discuss their case.
FAQ
What is crypto transaction graph analysis in simple terms?
Crypto transaction graph analysis is the process of mapping blockchain transactions as a network of nodes and edges to trace fund flows and identify related wallets. It converts public ledger data into structured evidence for forensic investigations and asset recovery.
How do analysts analyze crypto transactions using graph methods?
Analysts extract blockchain data, build UTXO or address graphs, apply heuristics like common-input ownership and gas-funding signatures, and score clusters on a quantitative scale to identify probable wallet ownership. Temporal queries then reconstruct the historical timeline of fund movements.
Can mixers make crypto tracing impossible?
Mixers increase tracing complexity but do not break the graph entirely. Modern graph neural networks and behavioral fingerprint analysis can still detect characteristic mixing patterns, because operational habits persist even when addresses change.
What is the difference between a UTXO graph and an address graph?
A UTXO graph treats transactions as nodes and traces the exact path of specific coins through a directed acyclic graph. An address graph treats wallet addresses as nodes and is better suited for clustering related wallets and identifying behavioral patterns across a broader network.
When should individuals or businesses consult a professional for graph analysis?
Cases involving mixers, cross-chain activity, or large-scale fraud require professional forensic support. Errors made early in the analytical workflow compound through every subsequent step, and professional investigators bring the tooling, scoring discipline, and documentation standards needed to produce legally defensible findings.